Description
Data Analysis Toolkit
Graphical and Statistical Analysis without fuss
Our Data Analysis Toolkit puts professional grade graphical and statistical analysis at your fingertips you spend your time delivering results, not learning software
Easy to use
A completely intuitive interface. Just select the data and the graphs and statistical analyses you want. No menus. Only the options you need. The easiest possible interface for learners and experts alike.
Immediate Results
Enter all your data in one go, then select which variable to plot and the graphs update automatically. Use hyperlinks to jump to the graph you want. A step change in your productivity.
High Quality Graphics
Clear, beautifully presented visuals give your work a professional look that conveys information at a glance.
Secure, Safe, Hassle free
There’s nothing to install the Data Analysis Toolkit is a familiar Excel spreadsheet, with no macros.
All the Analysis You Need
The Data Analysis Toolkit features:
- Time Series plot
- Individual and Moving Range Control Charts
- X Bar R Control Charts
- Histogram with Normality Test and Probability Plot
- Process Capability analysis
- Stratified Time Series plots and Box Plots
- Multiple Time Series Plots and Box Plots
- 2 sample t and paired t tests
- Test for Equal Variance and ANOVA
- Main Effects Plots and Multi Vari Chart
- Fitted Line Plot and Regression with Residuals Analysis
- Pareto Chart with additional analysis of main category
- 2 proportions test
- Chi Squared test
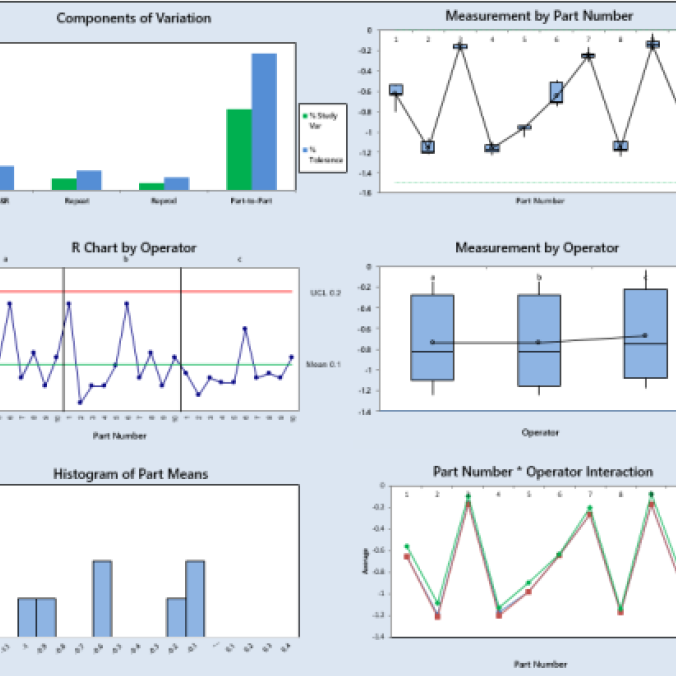
- Gauge R&R including Gauge Run Chart
- Attribute Agreement Analysis
- Design of Experiments with 2, 3 or 4 factors
- Data stacking and unstacking utility
| Excel Versions | : | Microsoft Excel 2013 or later |
| Licensing | : | 5 year license validity |
| Turnaround | : | 24 – 48 hours |
| Trial Version | : | 30 days free trial. please contact us for details |
| Bulk Discounts | : | For purchase of above 25 copies please contact us for volume discount |


Reviews
There are no reviews yet.