
What is process mapping? Does process mapping play a vital role in recognizing the problem that your organization is facing? In definition, process mapping is the illustrative representations and descriptions to show the organizational value stream, which could include the process of transforming raw material to end goods or raw information to serviceability. It helps the project team to visualize the details of the process closely and aid indecision-making. Besides that, a process map can be used to identify the major areas of strengths and weaknesses in the existing process. Furthermore, the analysis of process mapping can assist in reducing the cycle time and defects in the process and enhancing productivity. A good and precise process map can illustrate the flow of the work and the interaction within the organization by using symbols that are easily understood. A well-prepared process map should contain proper detail concerning multiple paths, decisions and rework loops. There are few charts that you can use in process mapping to ensure the smooth sailing in the projects you are working on.
FLOW CHART
A flowchart is a visual technique for dissecting a process by integrating and capturing the combined knowledge of everyone associated with the process. A flowchart is commonly used for performing process mapping during multiple phases of the Six Sigma project. A flowchart is also known as a process flow diagram, and can be used to depict distinct steps in a process in sequential order from top to bottom of the page. The basic idea of a flowchart is to include all steps of critical importance to the process. When it comes to collecting all the data you do not want to miss the crucial aspects. Not only that, but a flowchart also helps the team to visualize the whole process.
HOW TO DRAW FLOW CHART (DIFFERENT SHAPE, DIFFERENT FUNCTION) / ELEMENTS OF THE FLOWCHART

The diagram below is a flowchart example that shows how clinical cases shall be processed in a hospital. This flowchart uses decision shapes intensively in representing alternative flows.
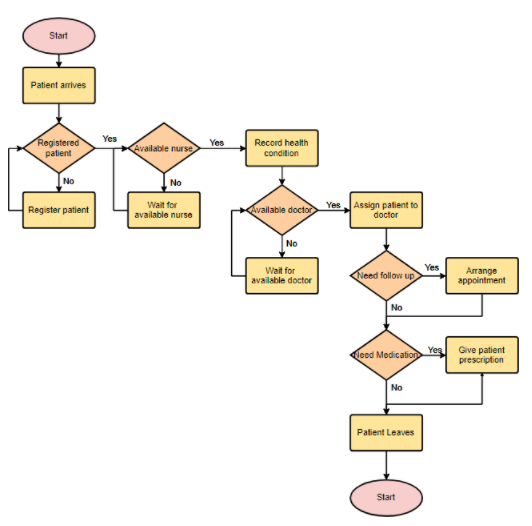
Picture credit: https://online.visual-paradigm.com/diagrams/templates/flowchart/medical-services/
SWIMLANE DIAGRAM
Swimlane flowchart or also known as a cross-functional flowchart is a type of flowchart that determines who does what in a process. By using the metaphor of lanes in a pool, a Swimlane diagram provides clarity as well as accountability by placing process steps within the horizontal or vertical position of a particular employee, group or department. It helps to show connections, communication between these lanes which also aims to highlight waste, redundancy, and inefficiency in a process. The benefit of using the Swimlane flowchart is, it helps to ensure that Employee A knows what Employee B is doing in an organization. This is because a Swimlane flowchart is used to highlight which process steps or sub-processes are assigned to a particular department or employee in the organization. The Swimlane flowchart also helps to highlight the redundancies between different lanes and to identify bottlenecks, waste during the process. This sometimes reveals duplicative or unnecessary steps in a process, for example, different groups or departments are doing the same task, which can cause process delays and capacity constraints within a particular Swimlane. With that, the problems can be addressed and resolved in order to increase performance and quality and to reduce unnecessary work and cost.
HOW TO DRAW SWIMLANE DIAGRAM (HOW DOES SWIMLANE LOOKS LIKE, STEPS TO DRAW) / ELEMENTS OF SWIMLANE FLOWCHART
Using standard symbols to any type of process flowchart, Swimlane introduces parallel or vertical, or horizontal lines grouping the process steps by the assigned individual such as employee, group, or department. Process steps are spelled out within their respective lanes, to how the interconnections of steps between lanes. By doing this, it shows how each employee or department is interacting with one another to keep a process rolling efficiently.
Steps to draw and use a Swimlane diagram
- List the participants– down the left to create horizontal Swimlane, either drawing by hand or using diagramming software. If you learn it later that it would be practical to have vertical Swimlane, then you can redo them (or rotate them) across the top.
- Use standard symbols to depict the process steps– sequentially in their appropriate Swimlane.
- Confirm your diagram– with participants in the process and make any necessary adjustments.
- The diagram can now be used– to communicate a standardized process for quality and training purposes, to clarify responsibilities and accountabilities, and to reveal inefficiencies and gaps.
- A new diagram can be drawn– to model a new process and show new responsibilities, allowing analysts and participants to study the pros and cons and further refine the process
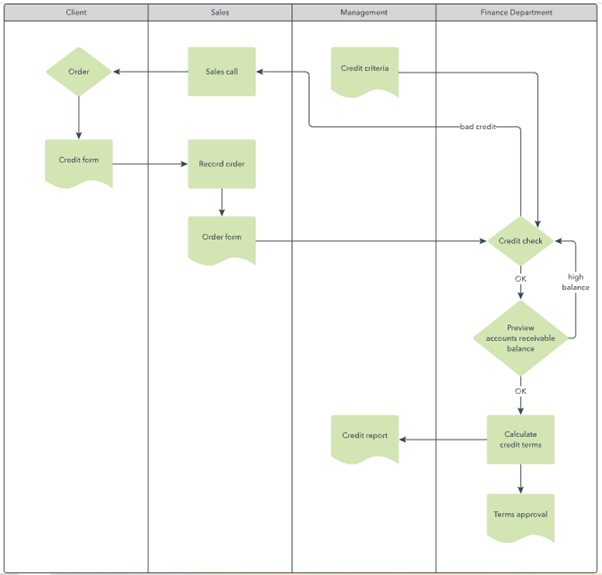
Picture credit: https://www.lucidchart.com/pages/tutorial/swimlane-diagram
THE BENEFITS OF PROCESS MAPPING
There is no success without mistakes and you should not be afraid to make one. Mishaps can happen in any organization regardless of the how big and small the organizations are, be it a mega corporation or just a small business in town. Without a proper planning on how to run the business processes, orders or services tend to get convoluted over time. Mistakes can happen in your organization, for example an order passed from the receptionist to department A but it gets passed to another department, orders may get tangled and even worse and important data may not be able to be conveyed. The Head of the department may be getting a headache thinking about how he or she can get this problem fixed so that it won’t happen in the near future? The answer is: by using process mapping. The good thing about process mapping is that, it engages everyone from various departments and positions to get involved in the process. This also involves the inputs, outputs, steps and process time. A process map also takes the information to convey it on a diagram so that everyone can understand the process entirely to figure out the value-added, value enabled and non-value added in the process.
Lean Sigma Experts Australia provides various Lean Six Sigma training stages such as Yellow Belt, Green Belt, Black Belt, and Master Black Belt. Our consultants and trainers are Lean Six Sigma certified, and they have conducted training for many years for clients in different industries. For your information, Lean Sigma Experts Australia is an Accredited Training Organization, Curriculum Provider and Examination Center by IASCC and by Council for Six Sigma Certification. We offer the best price for Lean Six Sigma Training in Australia with certified trainers and complimentary training materials. If you wish to learn more about process mapping and Lean Six Sigma training, visit our website at https://sixsigmaonlinetraining.com.au/ to learn more about our Lean Six Sigma programmes.


